Our research team releases regular monthly housing trends reports. These reports break down inventory metrics like the number of active listings and the pace of the market. In addition, we continue to give readers more timely weekly updates, an effort that began in response to the rapid changes in the economy and housing as a result of the COVID-19 pandemic. Generally, you can look forward to a Weekly Housing Trends View and the latest weekly housing data on Thursdays with a weekly video update from our economists on Fridays. Here’s what the housing market looked like over the last week.
What this Week’s Data Means:
The real estate refresh has arrived, as active listings posted sizeable gains for the first time in three years. And the year-over-year gap closed rapidly, going from flat to convincingly positive territory in the span of a week. As anticipated in our April Housing Trends report, we saw the number of homes actively for sale on Realtor.com even out two weeks ago for the first time since June 2019, and last week inventory grew convincingly year over year for the first time since March 2019.
Buyers continue to face a challenging market, with for-sale homes lagging behind historical levels and asking prices still rising double-digits year-over-year, after hitting yet another record-high in April. Even so, the accelerated change in inventory trends is a welcome one, driven by the combination of more sellers and fewer buyers able to contend with rising housing costs. For those persisting in their search for relatively affordable homes, recent trends indicate that creative approaches like larger down payments or selective relocation could pay off.
Key Findings:
The median listing price grew by 15.9 percent over last year. The typical asking price of for-sale homes was higher than one year ago by double-digits for a 21st week. As the Fed moves to rapidly normalize monetary policy following its early May hike with plenty of guidance to prepare markets for what’s ahead, mortgage rates continue to climb. While climbing rates that cut into buyer ability to afford monthly payments are expected to ultimately dampen home price growth, we have not seen that yet, perhaps because despite slipping confidence, consumers widely believe that mortgage rate increases will continue, giving a strong reason to make a purchase sooner rather than later for those who want to buy within a relatively soon time frame.
New listings–a measure of sellers putting homes up for sale–were up 6% above one year ago. Now that we’re in May, we’re in the heart of home selling season. Over the last few years, we have tended to see the number of new listings peak on an absolute basis this month while active inventory (newly listed homes plus those that have been on the market for a while) tends to peak in the fall. Seller confidenceamid record high asking prices is driving the growth in the number of sellers this year over last which we’ve seen in 6 of the last 7 weeks.
Active inventory moved convincingly into positive territory for the first time since 2019. While last week’s positive inventory improvement rounded to 0%, this week’s data built on that trend in a notable way, leading to the biggest year over year gain since March 2019. Our April Housing Trends Reportshowed that the active listings count remained 60 percent below its level right at the onset of the pandemic. This means that today’s buyers have just 2 homes to consider for every 5 homes that were available for sale just before the pandemic. In other words, homes for sale are still limited. However, more sellers combined with a slowing level of sales activity is causing a relatively rapid transition in conditions.
Homes spent 6 days less on the market than this time last year. Homebuyers who can act quickly have an edge in a still-competitive market, and this is especially true for those who may be hoping to stand out by offering something other than a larger down payment. Our April Housing Trends Report showed that homes sat on the market for less time than ever before–a feat normally not achieved until summer. Existing homeowners, who have seen their equity grow as home prices have soared, may have more options. But first-time homebuyers, many of whom are also contending with rents continuing to grow 4-5x faster than pre-pandemic, are feeling particularly pressured in this housing market. Some shoppers are relocating to find affordability, with metro areas in the Sunbelt, particularly Texas, seeing the biggest net improvement in traffic as locals stay and outsiders aim to move in for the affordability. First-time homebuyers can check out our first-time home buyer guide to prepare for the process and navigate the market more confidently. For repeat buyers contemplating how to buy and sell at the same time, our seller’s market place and information can give you options you may not have realized you had.
Data Summary:
All Changes year-over-year
Year-to-Date 2022
Week ending April 30, 2022
Week ending May 7, 2022
Week ending May 14, 2022
Median Listing Prices
+13.5%
+14.7%
+15.8%
+15.9%
New Listings
-1%
+3%
+4%
+6%
Active Listings
-17%
-3%
+0%
+5%
Time on Market
10 days faster
7 days faster
6 days faster
6 days faster
Subscribe to our mailing list to receive updates on the latest data and research.
April Rental Report: Sun Belt Metros Drive Sustained Growth in Nationwide Rents
April Highlights
Rent has reached yet another high ($1,827) in Realtor.com data history, as growth continues nationwide at a pace in line with the last four months (+16.7%).
Studio units continue to see rents increase at a faster rate than larger units, reversing the pattern from last year, particularly in the largest metros like New York City (29.1%), Los Angeles (23.2%), and Chicago (21.5%).
Rent increases are most pronounced in Sun Belt metros, especially ones where housing demand from outsiders is growing faster than the supply of rental units built in recent years.
Nationwide Rents Continue Rapid Growth, but Pace Has Leveled Off
The median rent in the 50 largest US metropolitan areas reached a new record high in April: $1,827. Rent has been steadily increasing since January 2021, following the general trend in housing prices and rebounding from a dip in the first year of the pandemic. The rental supply has been strained in recent months, as evidenced by the national rental vacancy rate holding below 6% in each of the last three quarters. Landlords with fewer available units are able to charge higher rents, and at the same time, for-sale home prices continue to climb. Today’s renters are left with few options but to pay these rising rents.
Figure 1: Year-over-Year Rent Trend
One possible signal of relief from this surge can be found by tracking year-over-year rent growth. April’s rents were up 16.7% from April 2021. This marks the third consecutive month in which year-over-year rent growth has slowed, albeit modestly, from the 17.1% peak this January. Still, this level of rent increase is severe. If annual rent growth were to remain around 17% through the summer, the national median rent would eclipse $2,000 this August.
Studio Rents are Growing the Fastest
Studio unit rents increased at the fastest pace again this month, growing 17.2% from April 2021 compared to 15.9% for 2-bedroom units and 15.6% for 1-bedroom units. Studios have seen the most year-over-year rent growth every month so far this year, rebounding later than larger rentals from the price decreases in late 2021 and early 2021. 1- and 2-bedroom rents both decreased in year-over-year growth from March into April, driving the general slowdown. Studio apartments are less costly and generally attract renters with more flexible living arrangements, so they were more easily vacated early in the pandemic and are now in higher demand for those looking to move into their own place or to return to major city centers. Studio rents in New York City (29.1%), Los Angeles (23.2%), and Chicago (21.5%) all grew at a faster year-over-year rate than the national average.
Table 1: National Rents by Unit Size
Unit Size
Median Rent
Rent YoY
Rent Change – 2 years
Overall
$1,827
16.7%
21.0%
Studio
$1,499
17.2%
15.3%
1-bed
$1,675
15.6%
19.7%
2-bed
$2,552
15.9%
23.7%
Figure 2: National Rent by Unit Size Trend
Rent Growth Concentrated in Sun Belt
Leading the charge in nationwide rents are three Florida metros. Rent in Miami was up 51.6% from April of last year. Orlando (32.9%) and Tampa (27.8%) followed close behind. Recent analysis of cross-market search demand has shown that homebuyers are increasingly interested in relocating to the Sun Belt, and this migration trend has made its way into the rental market as well.
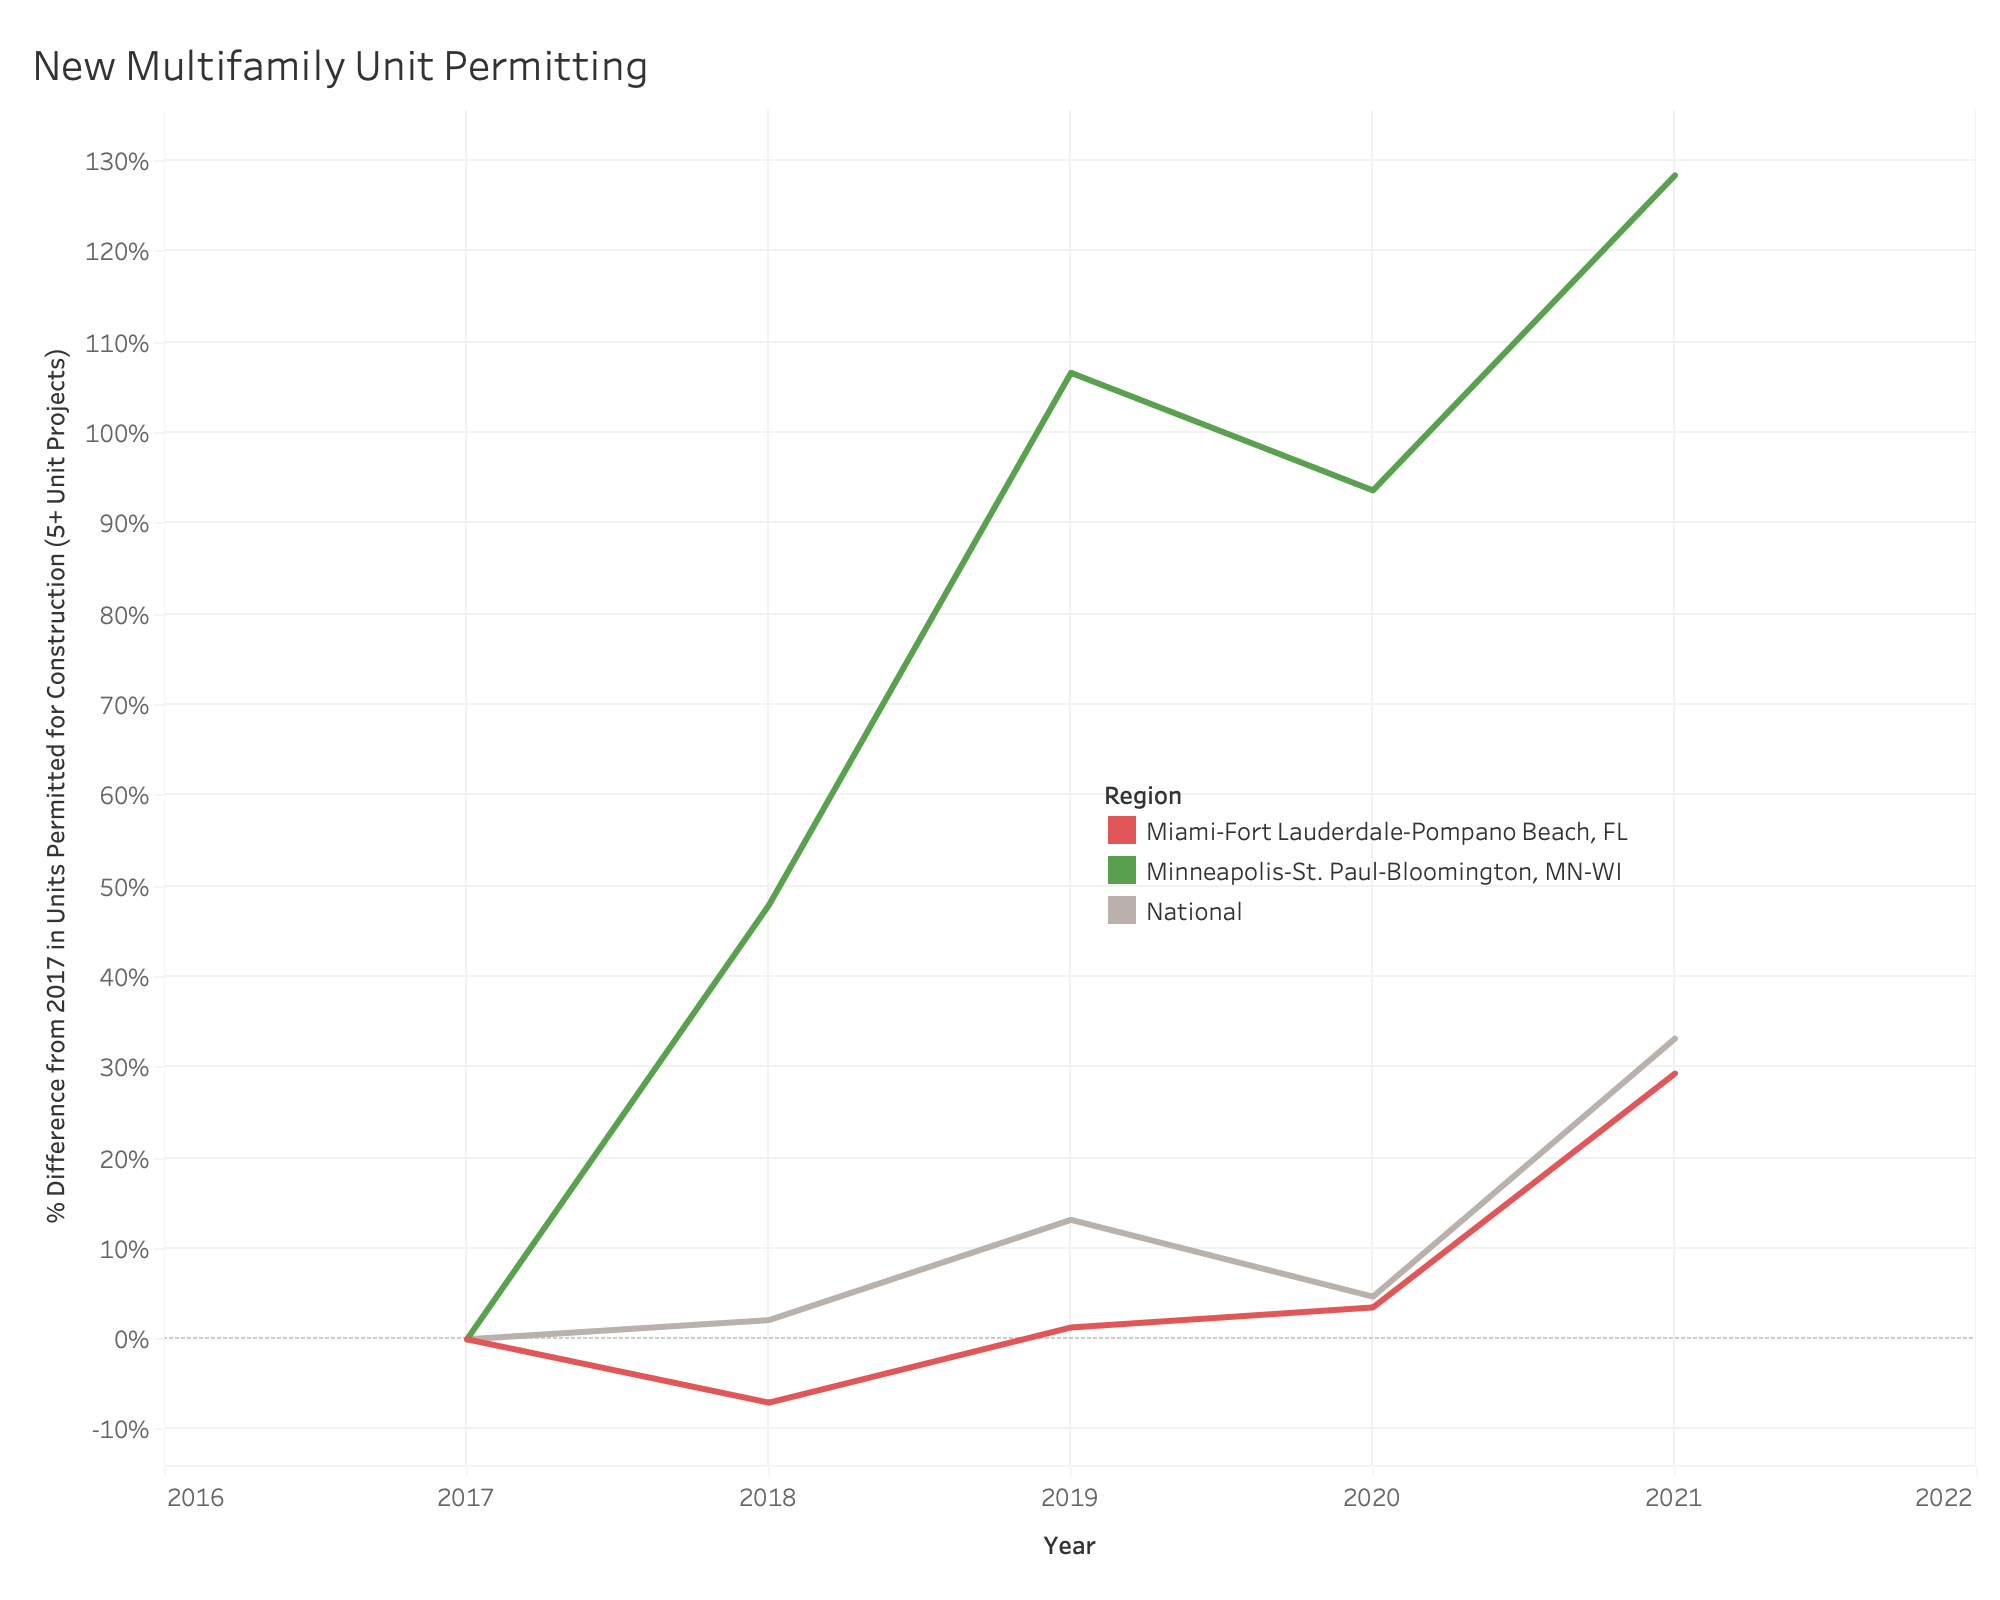
Along with the top three rent growth metros in Florida, southern and southwestern cities like San Diego (25.6%), Las Vegas (24.8%), Austin (24.7%), Nashville (24.1%), Raleigh (23.9%) and Jacksonville (23.3%) are among the top ten markets where rent has grown the fastest year-over-year. Conversely, the chillier climates of Pittsburgh (4.2%), Detroit (4.5%), and Minneapolis (5.5%) have contributed to these metro areas landing in the bottom three for rent growth. In the case of Minneapolis, a supply-side factor is also in play, as the growth in the number of units permitted for construction in building projects of five units or more has far outpaced the national average over the past four years. Meanwhile, Miami has trailed the national growth in new multifamily construction, and the lack of housing options for new arrivals to the area has added fuel to the rent growth fire.
Rental data as of April for units advertised as for-rent on Realtor.com®. Rental units include apartment communities as well as private rentals (condos, townhomes, single-family homes). All units were studio, 1-bedroom, or 2-bedroom units. We use communities that reliably report data each month within the top 50 largest metropolitan areas. National rents were calculated by averaging the medians of the 50 largest metropolitan areas.Realtor.com® began publishing regular monthly rental trends reports in October 2020 with data history stretching back to March 2019.
Note: With the release of its February 2022 rent report, Realtor.com® incorporated a new and improved methodology for capturing and reporting rental listing trends and metrics. The new methodology is expected to yield a cleaner and more consistent measurement of rental listings and trends at both the national and local level. The methodology has been adjusted to better account for cases where new or missing data may not be completely at random. Most areas across the country will see minor changes with a smaller handful of areas seeing larger updates. As a result of these changes, the rental data released since March 2022 will not be directly comparable with previous releases (files downloaded before March 2022) and Realtor.com® economics blog posts. However, future data releases, including historical data, will consistently apply the new methodology.
Subscribe to our mailing list to receive updates on the latest data and research.
Homeownership rates for Asian Americans are growing, up to 61.2% in 2021Q4, but homeownership still lags behind that of white Americans, 74.4% in the same period.
Consistent with rising homeownership, our name-matched deeds data suggests a growing share of home sales to Asian Americans, 4.6% in 2021 compared to 3.7% 2020.
Similar to findings for other studied groups, such as Hispanics and Blacks, home sales have grown more among millennial and female Asian Americans than their older or male counterparts.
Homeownership is a big part of the “American Dream” for Asian Americans in many ways. Owning a home is a sign of success and financial stability, but in many Asian cultures, it is also a significant commitment to the relationship among family members. While Asian people in the U.S. tend to have higher educational attainment and household income than any other racial and ethnical groups, their homeownership rate (59.9%) is much lower than the national rate of 65.5% and the white community rate of 74.4%. A recent study by CAPACDshows that language barriers in the buying process and the prevalence of multigenerational living, which often coincides with higher housing cost burdens, are among the challenges faced by Asian American households.
To honor the 2022 Asian American and Pacific Islander Heritage Month, Realtor.com took a broader view to understand how Asian American homebuyers have interacted with the housing market in recent years. In addition, we want to compare home sales trends between Asian American buyers and their non-Asian peers. We matched primary homebuyers’ last names using deed records with the Census’s last name origins to parse buyers’ ethnicity. In addition, we join primary buyers’ first names with gender and generational likelihood to make comparisons between different gender and generation groups among Asian American homebuyers.
Figure 1: Recent Homeownership Rate by Race
Asian Americans Homebuyers Pulled Back Early in the Pandemic But a Bigger Rebound Than Their Non-Asian Peers Followed
Figure 2 shows home buying trends among Asian American buyers and their peers between March 2019 and December 2021. The Home Sales Index (HSI) was calculated to compare home purchases by buyers relative to the group’s March 2019 purchasing behavior (set as an index of 100). Before the onset of the pandemic, Asian homebuyers grew at a faster pace than non-Asian buyers. The average Home Sales Index (HSI) for Asian American buyers between March 2019 and Feb 2020 was 118.3 , 3.1% higher than their peers.
However, the outbreak of the pandemic changed the trajectories of Asian American homebuyers. During the first half-year, the buying pace of Asian American homebuyers slowed significantly, ultimately lagging behind their non-Asian counterparts over this period. The average Asian American HSI dropped to 109.5, 8.1% lower than their pre-pandemic levels and 9.5% lower than their non-Asian peers. The immense increase in anti-Asian crimes may have halted the home buying process for some. Fears of being isolated from larger Asian American communities by moving to more affordable areas like smaller cities and the suburbs likely took otherwise viable options off of the table, derailing plans. For example, between March and September 2020, 67 anti-Asian hate crime events were reported in California, the state with the highest Asian American population, a 139% increase from the same period in 2019.
Even though Asian American homebuyers experienced significant challenges, they are the group that had the largest homeownership rate increase in recent years. For example, between 2020Q4 and 2021Q4, the homeownership rate of Asian American households increased from 59.5% to 61.2%, up 1.7 percentage points, while all other racial groups saw homeownership rate declines over the same period. Our name-matched deed records showed similar trends: the share of Asian American homebuyers among all buyers jumped from 3.7% (2020) to 4.6% (2021). In addition, Asian American homebuyers rebounded faster than non-Asian American peers after October 2020. The average HSI for Asian buyers jumped to 154 between October 2020 and December 2021, 30.8% higher than their pre-pandemic levels and 19.6% faster than non-Asian peers. One potential explanation for the strong rebound is that they have higher motivations to take advantage of the historically low mortgage rates. According to a recent financial study by the Consumer Financial Protection Bureau (CFPB), Asian American borrowers generally live in relatively expensive metro areas, resulting in higher average loan amounts than their peers. Therefore, the historically low mortgage rates might have been more attractive to Asian buyers, which eventually led to a higher pace of home sales.
Figure 2: Home Sales Index: Asian American vs. Non-Asian American Homebuyers
Female Asian American Homebuyers Outpace Asian American Males
Figure 3 shows gender specific home buying trends among Asian American buyers between March 2019 and December 2021. Before the onset of the pandemic, homebuying among Asian American females grew faster than among Asian American males. The average Home Sales Index (HSI) for female Asian American buyers between March 2019 and Feb 2020 was 120.3 , 3.0% higher than their male peers.
The impact of the pandemic was felt relatively equally by male and female Asian American buyers, with male and female average HSI’s of 98 and 103, respectively, between March and July 2020, down significantly from pre-pandemic. However, post pandemic, Asian American female homebuying recovered more quickly than for Asian American males. In June 2021, Asian American homebuying peaked for both males and females. Asian American females saw a peak HSI of 197.3, nearly two times the rate of homebuying as compared to the baseline in March 2019, and almost two times the rate in June 2020. On average, between July 2020 and December 2021, Asian American females had an HSI 8% higher (157) than Asian American males (145.5). This means that the growth rate in home purchases by Asian American females grew more than that for males and that the gap widened in the housing market’s pandemic recovery.
Figure 3: Home Sales Index: Asian American Male vs. Asian American Female Homebuyers
Asian American Millennials Outpace Other Generations
The timing of the pandemic coincided with peak home-buying years for millennials, resulting in millennial first-time home buyers entering the market at higher rates than other generations. This trend was consistent within the Asian American population, as shown in Figure 4. Before the onset of the pandemic, all generations of Asian American homebuyers were trending quite closely. However, the generations start to split apart at the onset of the pandemic in March 2020, and from there forward, millennial Asian Americans are seeing greater growth in homebuying than other generations of Asian Americans.
Interestingly, within the Asian American population, the rate of homebuying in the observed time period is generally highest for the youngest generation studied (millennials), and lowest for the oldest generation studied (Silent), with Gen X and Boomers falling in line according to age in between. The pandemic hit older generations of Asian American buyers hardest in May 2020, with the Silent generation, Boomers and Gen X slowing buying to HSI’s of 74.0, 76.3 and 80.8, respectively. Millennial buying behavior was impacted slightly less severely, only reaching an index of 90.4.
In the months following the onset of the pandemic, all generations recovered, but millennials outpaced the older generations. Between August 2020 and December 2021, Asian American millennials sustained an average HSI of 159.1, compared to Gen X’s index of 148.9, Boomers’ index of 145.0, and Silent generation’s index of 145.5. In other words, millennials grew homebuying activity by 59% over their pre-pandemic pace while other generations saw activity grow by only 45% to 49%, on average.
Figure 4: Home Sales Index: Asian American Homebuyers by Generation
Asian American Millennials Outpace Non-Asian Millennials in Homebuying Post-Pandemic
As shown in Figure 5, Asian American and non-Asian American millennials tracked fairly closely in their rate of homebuying (as compared to the March 2019 baseline) pre-pandemic. However, as discussed previously, Asian American homebuyers saw a sharp decline in activity early in the pandemic, perhaps due to safety concerns, a force which was felt by all generations, including millennials. During the March – July 2020 timeframe, the HSI for Asian American millennials was 115, while the index for non-Asian American millennials was 8.7% higher (125). The dampening effect of the pandemic and related safety concerns was especially severe in May 2020, when the HSI for Asian American millennials dropped to 90.4 while the HSI for non-Asian American millennials was higher at 104.
After this early-pandemic stage, Asian American millennials started buying homes at a faster-growing rate than non-Asian American millennials, reaching a peak HSI of 196.5 in June 2021, as compared to the non-Asian American millennial peak of 175.5 in the same month. Between August 2020 and December 2021, Asian American homebuyers had an average HSI of 159, which translates to an average nearly 60% more buying activity compared to the March 2019 baseline. In the same timeframe, non-Asian American millennial buyers had an average HSI of 144.4, a growth rate of less than 45% over their March 2019 baseline, lagging the improvement in Asian American millennials’ rate of homebuying by 9.2%.
Figure 5: Home Sales Index: Asian vs Non-Asian American Millennials
Methodology
Sales information is obtained from the Realtor.com public records database. In the analysis, we examine arms-length transactions that occurred between March 2019 and December 2021. An arms-length transaction is one in which buyers and sellers each act in their self-interest to try to get the best deal they can. The most common non-arm’s length transactions are sales between family or friends. Find out more about arm’s length home sales here. We further narrow our samples to non-corporate transactions. A transaction is defined as a non-corporate deal when the primary buyer is an individual. We also exclude individual buyers who purchase properties via family trusts and limited liability companies. For the purpose of this study, we only include residential properties.
Buyer ethnicity is parsed using the primary buyer’s last name from the deed record and an estimation of their racial and ethnic origins from the 2010 Decennial Census Surname Files. The file contains 162,253 unique last names which occurred 100 or more times in the 2010 Census. For each last name, the Surname File includes the likelihood of a name being Asian American. Buyer gender is identified using the primary buyer’s first name from the deed record and gender likelihood from public information on data.world. Buyer generation is parsed using the primary buyer’s first name from the deed record and Social Security Administration data on names and birth years. The file includes first names between 1920 and 1997. For each first name, we count its frequency for each year. We also assign a generation for each year (millennial: between 1981 and 1997; Gen-X: between 1965 and 1980; Boomer: 1946 and 1964; Silent: before 1946). We calculate the generation likelihoods from these counts. For all buyer types, likelihoods are used as weights to estimate the number of each type of homebuyer.
The Home Sales Index (HSI) is calculated by using March 2019 as a benchmark in the number of home sales. The index is the number of sales relative to March 2019, multiplied by 100 (i.e. March 2020 sales count/March 2019 sales count * 100). The index is used to normalize the data in order to compare the growth of home buying by different segments of the population in the studied timeframe.


