
April Rental Report: Sun Belt Metros Drive Sustained Growth in Nationwide Rents
April Rental Report: Sun Belt Metros Drive Sustained Growth in Nationwide Rents
April Highlights
- Rent has reached yet another high ($1,827) in Realtor.com data history, as growth continues nationwide at a pace in line with the last four months (+16.7%).
- Studio units continue to see rents increase at a faster rate than larger units, reversing the pattern from last year, particularly in the largest metros like New York City (29.1%), Los Angeles (23.2%), and Chicago (21.5%).
- Rent increases are most pronounced in Sun Belt metros, especially ones where housing demand from outsiders is growing faster than the supply of rental units built in recent years.
Nationwide Rents Continue Rapid Growth, but Pace Has Leveled Off
The median rent in the 50 largest US metropolitan areas reached a new record high in April: $1,827. Rent has been steadily increasing since January 2021, following the general trend in housing prices and rebounding from a dip in the first year of the pandemic. The rental supply has been strained in recent months, as evidenced by the national rental vacancy rate holding below 6% in each of the last three quarters. Landlords with fewer available units are able to charge higher rents, and at the same time, for-sale home prices continue to climb. Today’s renters are left with few options but to pay these rising rents.
Figure 1: Year-over-Year Rent Trend

One possible signal of relief from this surge can be found by tracking year-over-year rent growth. April’s rents were up 16.7% from April 2021. This marks the third consecutive month in which year-over-year rent growth has slowed, albeit modestly, from the 17.1% peak this January. Still, this level of rent increase is severe. If annual rent growth were to remain around 17% through the summer, the national median rent would eclipse $2,000 this August.
Studio Rents are Growing the Fastest
Studio unit rents increased at the fastest pace again this month, growing 17.2% from April 2021 compared to 15.9% for 2-bedroom units and 15.6% for 1-bedroom units. Studios have seen the most year-over-year rent growth every month so far this year, rebounding later than larger rentals from the price decreases in late 2021 and early 2021. 1- and 2-bedroom rents both decreased in year-over-year growth from March into April, driving the general slowdown. Studio apartments are less costly and generally attract renters with more flexible living arrangements, so they were more easily vacated early in the pandemic and are now in higher demand for those looking to move into their own place or to return to major city centers. Studio rents in New York City (29.1%), Los Angeles (23.2%), and Chicago (21.5%) all grew at a faster year-over-year rate than the national average.
Table 1: National Rents by Unit Size
| Unit Size | Median Rent | Rent YoY | Rent Change – 2 years |
| Overall | $1,827 | 16.7% | 21.0% |
| Studio | $1,499 | 17.2% | 15.3% |
| 1-bed | $1,675 | 15.6% | 19.7% |
| 2-bed | $2,552 | 15.9% | 23.7% |
Figure 2: National Rent by Unit Size Trend

Rent Growth Concentrated in Sun Belt
Leading the charge in nationwide rents are three Florida metros. Rent in Miami was up 51.6% from April of last year. Orlando (32.9%) and Tampa (27.8%) followed close behind. Recent analysis of cross-market search demand has shown that homebuyers are increasingly interested in relocating to the Sun Belt, and this migration trend has made its way into the rental market as well.
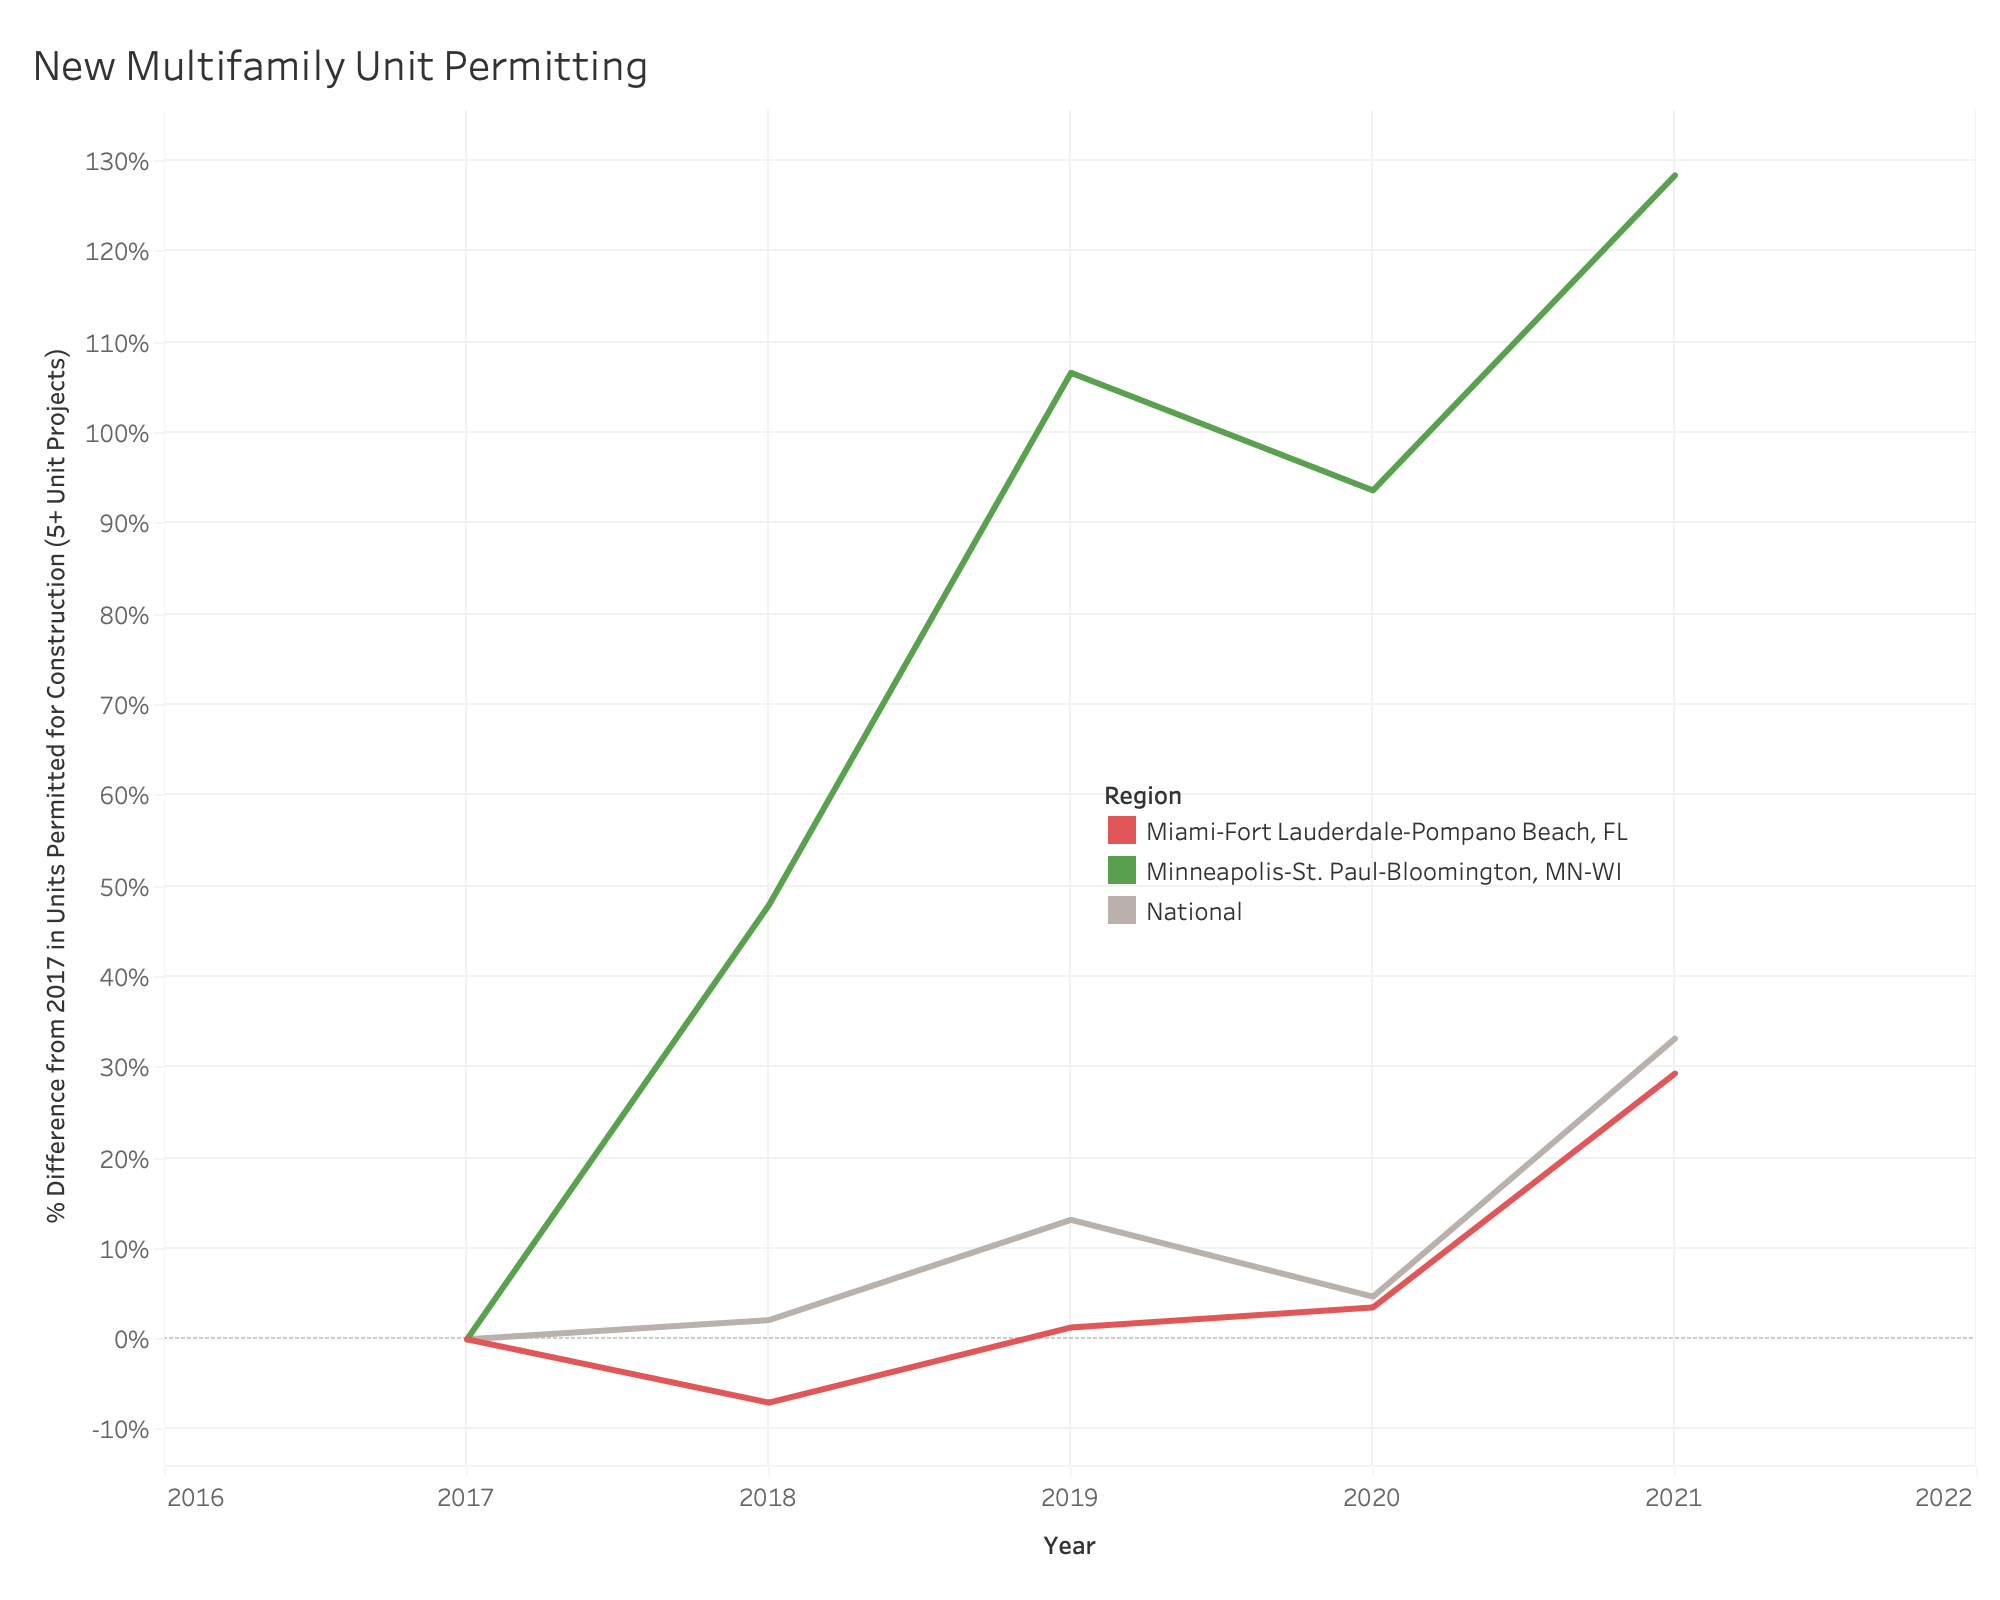
Along with the top three rent growth metros in Florida, southern and southwestern cities like San Diego (25.6%), Las Vegas (24.8%), Austin (24.7%), Nashville (24.1%), Raleigh (23.9%) and Jacksonville (23.3%) are among the top ten markets where rent has grown the fastest year-over-year. Conversely, the chillier climates of Pittsburgh (4.2%), Detroit (4.5%), and Minneapolis (5.5%) have contributed to these metro areas landing in the bottom three for rent growth. In the case of Minneapolis, a supply-side factor is also in play, as the growth in the number of units permitted for construction in building projects of five units or more has far outpaced the national average over the past four years. Meanwhile, Miami has trailed the national growth in new multifamily construction, and the lack of housing options for new arrivals to the area has added fuel to the rent growth fire.
___________________________________________________________________________
Rental Data – 50 Largest Metropolitan Areas – April 2022
| Metro | Overall Median Rent | Overall Rent YY | Studio Median Rent | Studio Rent YY | 1-br Median Rent | 1-br Rent YY | 2-br Median Rent | 2-br Rent YY |
| Atlanta-Sandy Springs-Roswell, GA | $1,829 | 16.7% | $1,665 | 17.9% | $1,700 | 17.4% | $2,035 | 17.7% |
| Austin-Round Rock, TX | $1,800 | 24.7% | $1,450 | 25.0% | $1,652 | 26.7% | $1,951 | 18.5% |
| Baltimore-Columbia-Towson, MD | $1,800 | 12.5% | $1,485 | 12.5% | $1,701 | 12.1% | $1,900 | 11.0% |
| Birmingham-Hoover, AL | $1,189 | 7.8% | $1,073 | 11.7% | $1,120 | 7.2% | $1,283 | 8.3% |
| Boston-Cambridge-Newton, MA-NH | $2,825 | 22.7% | $2,400 | 27.4% | $2,600 | 18.3% | $3,190 | 23.9% |
| Buffalo-Cheektowaga-Niagara Falls, NY | $1,290 | 7.5% | $1,125 | 2.7% | $1,125 | 3.0% | $1,445 | 7.8% |
| Charlotte-Concord-Gastonia, NC-SC | $1,675 | 19.5% | $1,563 | 21.8% | $1,588 | 21.3% | $1,840 | 17.3% |
| Chicago-Naperville-Elgin, IL-IN-WI | $1,923 | 13.5% | $1,580 | 21.5% | $1,880 | 13.9% | $2,160 | 9.6% |
| Cincinnati, OH-KY-IN | $1,416 | 8.9% | $1,200 | 13.2% | $1,360 | 8.8% | $1,576 | 8.4% |
| Cleveland-Elyria, OH | $1,409 | 10.7% | $950 | 4.4% | $1,319 | 6.2% | $1,540 | 14.1% |
| Columbus, OH | $1,275 | 11.1% | $1,095 | 10.1% | $1,200 | 11.9% | $1,390 | 9.4% |
| Dallas-Fort Worth-Arlington, TX | $1,655 | 21.3% | $1,375 | 18.5% | $1,508 | 22.4% | $1,918 | 20.3% |
| Denver-Aurora-Lakewood, CO | $1,970 | 15.3% | $1,600 | 14.7% | $1,848 | 16.0% | $2,331 | 16.3% |
| Detroit-Warren-Dearborn, MI | $1,385 | 4.5% | $1,074 | 7.9% | $1,165 | 6.4% | $1,545 | 4.6% |
| Hartford-West Hartford-East Hartford, CT | $1,626 | 7.5% | $1,497 | 32.5% | $1,440 | 2.9% | $1,955 | 11.7% |
| Houston-The Woodlands-Sugar Land, TX | $1,435 | 13.1% | $1,344 | 11.6% | $1,310 | 13.4% | $1,609 | 12.7% |
| Indianapolis-Carmel-Anderson, IN | $1,237 | 8.9% | $1,050 | 8.4% | $1,130 | 8.2% | $1,374 | 10.9% |
| Jacksonville, FL | $1,600 | 23.3% | $1,430 | 42.3% | $1,484 | 20.8% | $1,757 | 24.4% |
| Kansas City, MO-KS | $1,233 | 10.6% | $1,014 | 9.1% | $1,115 | 13.0% | $1,465 | 11.3% |
| Las Vegas-Henderson-Paradise, NV | $1,649 | 24.8% | $1,315 | 13.4% | $1,519 | 25.5% | $1,750 | 22.3% |
| Los Angeles-Long Beach-Anaheim, CA | $3,016 | 20.9% | $2,279 | 23.2% | $2,767 | 23.9% | $3,445 | 18.2% |
| Louisville/Jefferson County, KY-IN | $1,204 | 13.6% | $1,005 | 12.0% | $1,135 | 12.9% | $1,359 | 8.6% |
| Memphis, TN-MS-AR | $1,409 | 22.0% | $1,139 | 10.6% | $1,362 | 21.2% | $1,561 | 22.6% |
| Miami-Fort Lauderdale-West Palm Beach, FL | $2,800 | 51.6% | $2,450 | 45.9% | $2,462 | 45.7% | $3,150 | 54.8% |
| Milwaukee-Waukesha-West Allis, WI | $1,525 | 9.3% | $1,200 | 6.2% | $1,428 | 9.8% | $1,750 | 10.7% |
| Minneapolis-St. Paul-Bloomington, MN-WI | $1,580 | 5.5% | $1,245 | 4.2% | $1,495 | 5.5% | $1,925 | 4.4% |
| Nashville-Davidson–Murfreesboro–Franklin, TN | $1,760 | 24.2% | $1,749 | 22.7% | $1,618 | 20.3% | $1,914 | 26.9% |
| New Orleans-Metairie, LA | $1,798 | 12.4% | $1,300 | 28.4% | $1,590 | 6.3% | $2,020 | 7.8% |
| New York-Newark-Jersey City, NY-NJ-PA | $2,845 | 18.0% | $2,581 | 29.1% | $2,573 | 12.2% | $3,166 | 13.1% |
| Oklahoma City, OK | $985 | 13.0% | $913 | 30.6% | $916 | 14.6% | $1,050 | 11.2% |
| Orlando-Kissimmee-Sanford, FL | $1,927 | 32.9% | $1,630 | 23.7% | $1,772 | 30.9% | $2,190 | 36.9% |
| Philadelphia-Camden-Wilmington, PA-NJ-DE-MD | $1,775 | 7.6% | $1,413 | 2.0% | $1,679 | 4.1% | $1,975 | 6.1% |
| Phoenix-Mesa-Scottsdale, AZ | $1,915 | 20.1% | $1,429 | 20.4% | $1,650 | 20.7% | $2,225 | 14.7% |
| Pittsburgh, PA | $1,475 | 4.2% | $1,261 | 12.4% | $1,450 | 5.7% | $1,592 | -2.0% |
| Portland-Vancouver-Hillsboro, OR-WA | $1,764 | 12.1% | $1,400 | 9.8% | $1,710 | 11.2% | $2,049 | 11.8% |
| Providence-Warwick, RI-MA | $2,200 | 25.4% | $1,468 | 4.9% | $1,765 | 13.5% | $2,575 | 29.9% |
| Raleigh, NC | $1,615 | 23.9% | $1,458 | 22.1% | $1,485 | 24.5% | $1,791 | 21.3% |
| Richmond, VA | $1,435 | 17.0% | $1,147 | 15.0% | $1,305 | 18.1% | $1,559 | 16.4% |
| Riverside-San Bernardino-Ontario, CA | $2,729 | 12.3% | $1,400 | -6.7% | $2,184 | 14.5% | $3,000 | 13.3% |
| Rochester, NY | $1,320 | 9.5% | $980 | 8.6% | $1,265 | 13.6% | $1,405 | 7.7% |
| Sacramento–Roseville–Arden-Arcade, CA | $2,045 | 10.1% | $1,845 | 11.5% | $1,901 | 7.6% | $2,230 | 10.9% |
| San Antonio-New Braunfels, TX | $1,385 | 19.4% | $1,242 | 16.4% | $1,264 | 20.1% | $1,599 | 21.0% |
| San Diego-Carlsbad, CA | $3,125 | 25.6% | $2,447 | 23.1% | $2,769 | 22.5% | $3,500 | 23.5% |
| San Francisco-Oakland-Hayward, CA | $3,000 | 11.1% | $2,350 | 15.6% | $2,750 | 11.4% | $3,500 | 9.5% |
| San Jose-Sunnyvale-Santa Clara, CA | $3,165 | 19.9% | $2,490 | 23.9% | $2,920 | 18.8% | $3,545 | 18.2% |
| Seattle-Tacoma-Bellevue, WA | $2,165 | 17.2% | $1,799 | 23.4% | $2,145 | 16.2% | $2,633 | 18.4% |
| St. Louis, MO-IL | $1,331 | 8.7% | $1,000 | 6.1% | $1,272 | 10.8% | $1,462 | 6.1% |
| Tampa-St. Petersburg-Clearwater, FL | $2,163 | 27.8% | $1,989 | 28.0% | $1,896 | 28.0% | $2,390 | 26.6% |
| Virginia Beach-Norfolk-Newport News, VA-NC | $1,531 | 13.4% | $1,343 | 10.6% | $1,436 | 10.6% | $1,669 | 12.8% |
| Washington-Arlington-Alexandria,DC-VA-MD-WV | $2,115 | 12.4% | $1,722 | 14.1% | $2,017 | 12.2% | $2,499 | 10.6% |
Methodology
Rental data as of April for units advertised as for-rent on Realtor.com®. Rental units include apartment communities as well as private rentals (condos, townhomes, single-family homes). All units were studio, 1-bedroom, or 2-bedroom units. We use communities that reliably report data each month within the top 50 largest metropolitan areas. National rents were calculated by averaging the medians of the 50 largest metropolitan areas.Realtor.com® began publishing regular monthly rental trends reports in October 2020 with data history stretching back to March 2019.
Note: With the release of its February 2022 rent report, Realtor.com® incorporated a new and improved methodology for capturing and reporting rental listing trends and metrics. The new methodology is expected to yield a cleaner and more consistent measurement of rental listings and trends at both the national and local level. The methodology has been adjusted to better account for cases where new or missing data may not be completely at random. Most areas across the country will see minor changes with a smaller handful of areas seeing larger updates. As a result of these changes, the rental data released since March 2022 will not be directly comparable with previous releases (files downloaded before March 2022) and Realtor.com® economics blog posts. However, future data releases, including historical data, will consistently apply the new methodology.
Subscribe to our mailing list to receive updates on the latest data and research.


Related Posts