Maximize Your Borrowing Capacity With Asset Based Lending
Asset based lending is the process by which a person can acquire a loan, not based on the personal assets they have or the salary they earn, but by the real estate they currently own and its propensity to make money. The process of getting an asset based loan–a specific type of bridge loan (12-24 months) used only for investment and commercial properties–is generally quicker than dealing with institutional banks, requires less paperwork, and means that you will have cash in hand faster to spend more money and grow your business.
Asset based financing is helpful if you have had bad credit or a foreclosure, and are having trouble getting a loan from traditional banks. It is also helpful if you are experiencing rapid growth in your real estate investing and need the capital to continue the process.
How Asset Based Lending Works
In asset based lending, hard money lenders use your collateral, in this case real estate, to help you acquire additional cash to fund further projects. If your money is tied up in real estate, it is not liquid, and if your company is growing fast, odds are you need more cash to continue growing. This is where hard money lending comes in.
Hard money lenders can get cash in your hand more quickly than typical financial institutions, and the process requires less paperwork and offers more flexibility. Along with the equity in your current real estate assets, a hard money lender will look at accounts receivable, equipment, and inventory to determine your loan. Because the real estate itself is not liquid and you are not borrowing on your personal income, hard money lenders will usually have a higher interest rate than traditional banks.
What Do Hard Money Lenders Do?
In the fast paced real estate market, you don’t want to miss out on great deals just because your assets are not liquid. Hard money lenders at Stratton Equities will look at your assets and determine the maximum amount for your credit line. You can borrow as needed, and your credit base will shrink or grow as your assets change.
Keeping this line of credit open will allow you to grow your business and give you cash in hand, without waiting for your own cash receipts to catch up. This will also allow the hard money lenders the peace of mind that you have assets to forfeit if for some reason you default on your loan.
Benefits of Asset Based Lending
Whether you are trying to figure out how to finance a house flip or need a new construction loan, there are several benefits to acquiring asset based financing:
These loans are typically faster than a traditional loan, and require less documentation and paperwork. In addition to closing faster than a term loan, these loans have fewer underwriting guidelines and higher interest rates.
The cash flow asset based lending offers can bridge the gap between expenditures and incoming cash receipts for your business.
The loan can grow as your assets grow, leaving you with more liquidity to purchase more real estate.
The loan money can be used as you need it, and is not tied to a certain purpose (such as equipment purchase.)
Through asset based lending, Muevo Investments will make it easy to turn your collateral into cash, so you can finance your next big idea. If you have an investment or commercial property and wish to speak with one of our Loan Officers, Muevo Investments at 217-799-0156, email us today!
So, you might already know your way around real estate and have picked up a property or two. And if that’s the pace you want to go at, there is absolutely no problem with that whatsoever. Not everyone needs nor wants to build an empire.
But if you do want to “build an empire,” there’s several ways to accelerate your progress substantially, one of which is buying portfolios.
This is where you buy multiple properties at the same time instead of picking up one at a time. Of course, that doesn’t mean you have to buy a portfolio with 100 properties right of the get go. Instead, you can start by buying portfolios of two or three or ten houses or whatever comes your way.
Institutional Investors vs. Entrepreneurial Investors
First of all, there are two significant group of investors who are interested in buying portfolios; institutional investors and entrepreneurial investor as I call them. Institutional investors consist of real estate investment trusts (REITs) and other funds which examine portfolios like Wall Street assesses stocks.
For example, such investors constantly talk about gross yield and what their buy box is. Gross yield equals the annual rent divided by the total price and their “buy box” is the range of gross yield they will accept.
You might notice that this is not the most entrepreneurial way to examine the property. They mostly analyze portfolios for the cash flows as they need to hit certain returns for their investors.
Entrepreneurial investors should aim first for built-in equity and second for cash flow. You can get approximate numbers by looking at Zillow or Redfin, but at the end of the day, I would recommend any entrepreneurial investor to evaluate each property individually and add up the total of all their values to determine the total value of the portfolio.
Finding Portfolios
You can find portfolios on the MLS, Loopnet or sites specifically for portfolios like Entera. From time to time, you will also find portfolios listed on the Facebook marketplaces or even Craigslist. If you choose to, you can also market to these by using site like List Source to find people who have multiple units and then send them a letter or postcard (or both). You should also network and local REIA groups and other meetup events. Rub shoulders with investors who have a good number of units and when they finally decide to sell, you will likely be the first they reach out.
Rehab and Deferred Maintenance
Buying portfolios is similar to buying an apartment as there will always be some deferred maintenance on units that are currently rented.
Just like with an apartment you should walk every unit when you have the properties under contract. The only exception would be if the buyer will not allow it and it’s a sales condition. If you accept this condition you need to be much more conservative. It’s likely the units you do not view during your inspections need more work than the ones you do view. So make sure to add in a larger contingency for repairs in such cases.
Financing Portfolios
Keep in mind that there are not as many portfolio buyers on the market as buyers of individual properties. Most investors look for just a single house and big portfolio investors look for 100 plus in good neighborhoods. In many cases, this gives you a bit of an upper hand in the negotiating, especially if the seller is motivated. It’s unlikely they have a lot of other options. So seller financing is often something they will consider and, if needed, something you should ask for.
Since every house is on a separate parcel you may be able to use the lending option more creatively. For example, you could get a blanket loan on all of them with a bank, or just some of them while buying the rest for cash or with private lenders. Or you could split the closings up (if the seller allows) and close in two or three closings to make the financing easier.
It’s not very often that these portfolios come around, so portfolio investing shouldn’t be the only thing you do. But when you can find a quality portfolio, it is a great way to jumpstart your real estate business. Therefore, it’s definitely something to look for and be ready for when it comes around.
Commercial real estate comps are amongst the most valuable research pieces in the industry. In many cases, however, CRE teams rely on very manual in-house processes to aggregate and organize the necessary information.
The simple question: Is there an easy way for your team to compile data and analyze comparable properties to assess and size potential market opportunities?
We’re going to show you that, with Reonomy, real estate comps can become a consistent, reliable, and simple part of your team’s workflow.
How to Find Real Estate Comps
Commercial real estate comps are primarily used for one of two reasons:
1) To assess the value of a single property.
OR
2) To find duplicates of a favorable investment/business opportunity.
Appraisers, property buyers, and property sellers are among those who might turn to real estate comparables on a regular basis.
Appraisers The use of comps for appraisers is pretty straightforward. They need to determine the value of a property, and one of the largest determinants of that is the value of very similar surrounding properties.
Property Buyers A commercial buyer would look at comparables to make sure that they’re paying a favorable, or at least fair, price for land or property.
Property Sellers On the contrary, of course, a property seller would use comparables to make sure that they’re receiving a fair and favorable price for their parcel.
Okay, so comps are important. But how do you find them?
With Reonomy, the market’s leading provider of property intelligence, finding comps and their respective owners just takes a few quick clicks. Keep reading to learn more.
Reonomy Property Intelligence
While sales history is a large part of generating comparable properties, Reonomy harnesses property intelligence to generate comparables based on overall property value.
Value is assessed based on a combination of many factors, not just sale price.
How Reonomy Comps are Determined
Reonomy real estate comps are generated based on factors such as market conditions, geographic characteristics, and physical characteristics.
Market conditions typically revolve around the sales trends of the market in which an asset exists.
Geographic characteristics revolve around whether a comparable property is under the same locational influences of the subject property.
Physical characteristics are the building-level specs of a property, such as building size, age, and so on.
The properties that fall within a close geographic distance to that of your subject property and have comparable market, geographic and physical characteristics will be the ones that appear in your Reonomy list of comparables.
So, then, how do you actually go about doing this?
How to Find Comps with Reonomy
To find real estate comparables with Reonomy, you have to start with a property search.
In any case, once you know that you’re interested in it as a business or acquisition opportunity, you can begin your search for comparable assets.
On any individual property profile, see the “View Comparables” button next to the print logo near the top of the page.
Click that icon and Reonomy will present you with a list of comparable properties:
You’ll be presented with a list of properties that Reonomy deems to be comparable to your subject property.
From there, you can begin to dive into individual profile pages for comp properties to compare different assets more explicitly.
A useful workflow tool to use here is Reonomy’s table view of properties.
How to Utilize the Table View Feature After you’ve generated a list of comps, click the “Table” button at the top of the page to switch your view to a table and see more properties at once.
The table view allows you to see a list of properties without the active map view, so that you can see the same pieces of information for many different properties, all at the same time.
While viewing your comparable properties as a table, you can click the address of any property in the list, to jump to its property profile page.
You may also sort each column high-to-low, or vice versa, to see your property list in a specific order—like sales price, date of last, mortgage amount, building area, lender, and asset type.
How to Find Comps Near You
Finding real estate comps in your area is as simple as running a property search based on location.
For example, if you’re in Miami, Florida, looking for nearby comps…
You can simply run a search for Miami properties of a certain asset type and financial history, then, as we demonstrate above, click “View Comparables” on any asset.
Reonomy comps are very heavily driven by location, so most of your results will be within a short radius of your subject property, no matter where you’re looking.
And even if they aren’t, you can re-add or remove filters even after you’ve clicked to view comps. Once you click “View Comparables,” you can still broaden or narrow down your filtered list of properties.
How to Broaden Your Comp Search At any point in your comp search, you can click into the search bar at the top of the page, then add or take away filters.
Your ability to customize does not change at any point in any property search.
If you feel that your list of comparables is too broad or too narrow, you can simply take away or add the necessary filters to change your results to varying degrees.
If you think your search is too narrow, for example, simply remove some of the filters that were added when you ran your search for comps.
This will, in turn, generate more broad results.
How to Tighten Your Comp Search Perhaps you’ve run a comp search and found that the focus area is instead too broad.
To narrow your search down to a more refined geographic location, you can use the map area tools such as the draw and radius tools to tighten the range of your comp search.
You can also add more filters – perhaps more building and lot or sales filters, on top of what is already there, to make your comp search even more granular.
Real estate comps are there to lay the groundwork for you to continue your search and dive much further into markets, without losing any of the flexibility available on Reonomy’s search platform.
Find Comps by Owner Name or Entity
In some cases, you may want to find comparables to that of an owner you’re familiar with—an owner that has a portfolio similar to yours, or one that has a lot of similar properties.
To search for comparables by owner name, utilize the Ownership tab of the search page.
Here, you can search for an owner by name or LLC, to then dive into their properties and run comps in the same way we showed above.
Find Owner Contact Information of Comparable Properties
Now, let’s say you’ve found a comparable property, and would like to contact the owner of that property either as a buyer, seller, or someone looking to offer a service.
Reonomy’s robust property intelligence allows you to you to see the contact information of the individuals tied to a property’s ownership—and that includes the ability to pierce an LLC and see the people behind it.
Here, you can see the phone numbers, emails, and mailing addresses of all of the individuals tied to property ownership, as well as those that are likely the decision-makers.
Maximizing Your Expertise with Comps to Win New Business
You can use Reonomy’s real estate comps to search comparables on properties that you are already familiar with.
For example, let’s say you are an investor targeting multi-family homes in Austin, TX, and already have five properties that you know are perfect targets for your portfolio.
One way to capitalize on real estate comps is to start your comp search with one of those five properties.
This is a quick and easy way to use your existing knowledge of specific properties to uncover more potential opportunities.
Reonomy Versus the Alternatives
There are surely other options when it comes to finding commercial real estate comps. The issue, however, is that it can be extremely tedious, all the while returning results that might not even be of great use.
Given the fact that sales records are the basis of all comps, anywhere that you can access sales records, you can essentially glean your own comps. Unlike Reonomy, however, you’ll have to do a bit of your own digging.
Public Sales Records
With the help of your local county clerk, recorder, or assessor (the language and source can vary from county to county), you can either search for properties that have been recently sold, or you can search for a property you’re already aware of that sold to look up the price that the previous owner fetched.
While this method can be useful, it is useful in much smaller quantities, and will likely only generate a comp or two—unless you spend exorbitant amounts of time searching.
Hiring an Agent
One way to find real estate comps but save time is to hire an agent to do the searching for you.
In this scenario, you can let them decide how the comparables are found (they may even use Reonomy to do so), and spend your time on different tasks.
Wherever you might be in the US, and regardless of whether you’re an appraiser, buyer, or seller, Reonomy’s property intelligence and comp-generating capabilities offer the quickest path from start to the finish line, while offering near-complete customization along the way.
Keeping your business’ social media platforms up-to-date can be a time-consuming process. But, having a strong presence on relevant platforms is an important part of developing an effective marketing plan. Growing your audience can help you quickly achieve a much higher rate of brand recognition. Additionally, it allows you to create a greater level of awareness regarding any new products or services you offer. Luckily, there are many simple, free, or low-cost tools available today to help you with scheduling your social media posts all from one place. If you choose to use one of them, however, you will want to have a full understanding of both the benefits and disadvantages of doing so. Below we cover these pros and cons.
Common Applications and How They Work
If you are even remotely involved in the marketing functions of your business, there’s a good probability you’ve heard of (and perhaps even tested out) some of the more common social media scheduling tools. Apps like Later, Hootsuite, Shortstack, Buffer and Loomly are just a few of the many options currently on the market. While each of these platforms performs slightly differently, the overall premise of each is the same. Built into each application is a scheduling interface that allows you to link multiple social media accounts. Here, you can upload images, videos, and text you’d like to share with your followers. Choose a launch date and time and voila! Your accounts are consistently posting new content while you sleep, work, travel, or socialize.
Pros of Scheduling Your Social Media Posts
It sounds so easy it’s almost too good to be true; right? Well, it’s absolutely true that there are many benefits to pre-scheduling your social mediaposts. Here are some of the best reasons you might want to try it for yourself:
Time Management
Pre-scheduling your posts will absolutely afford you more time. Then you can devote the saved time to the other aspects of running your business. Set aside a couple of hours at the beginning of your week and you can have quality content posting each day. You can schedule your posts up to a month in advance or more, depending on the platform you choose to use. You are also able to access multiple social media sites at once, saving you the time and hassle of having to log in to each one individually.
Flexibility
Because you are able to choose your posting time, you are more likely to reach your audience during the peak hours they are active online. This is very helpful, as this may not be the ideal time for you to post. This can lead to more engagement on your profiles, and a better reach.
Strategy
Posting in advance allows you to create content that adheres to your overall brand theme. This gives your social media account an heir of cohesion. Sending a consistent message in this way allows your audience to gain a better understanding of what your business is all about.
Consistency
Scheduled posts helps you ensure you’re offering new and relevant material on a regular basis. Additionally, consistency can help you stay on top of the algorithm, since many apps see consistency as a sign of quality.
Repetition
Although repeating posts isn’t always the best idea, there will be times when it is beneficial to do so (promoting events, etc.). Advanced scheduling makes this process exponentially easier.
Broader Outreach
Because you do not have to necessarily be present during the time your post launches, you will be able to access an audience you may not otherwise reach if you only live-posted in the moments available to you.
Delegation
Pre-posting also affords you the ability to off-set your duties and allow an employee or marketing service provider take over your social media for you.
Cons of Scheduling Your Social Media Posts
Just like anything else in the world, there are pros and cons to scheduling. Here are some disadvantages for you to consider:
Engagement
Interacting with your audience is one of the fastest ways to build rapport with them. By pre-scheduling your posts, you may miss out on the opportunity to quickly respond to comments, messages, likes, and shares which can cost you several chances to convert your followers into clients.
Relevance/Social Awareness
Scheduling out too far in advance can run you the risk of appearing callous, inappropriate, or unaware of what’s going on around you. For example, when the current crisis of COVID-19 began, a travel agent trying to sell a vacation abroad would probably have appeared pretty tacky.
May Appear Spammy
Because you may not be consistently interacting with your audience, you also risk the possibility of your content appearing too spammy to your audience.
Mistakes
Posting too far in advance might increase your chances of linking back to content that is no longer available. There may also be moments where technology fails you and your post never goes live for one reason or another.
Redundancy
You don’t want to overwhelm your followers with the same information over and over again. Posting your content all at one time might find you in a particular mindset where all your posts are far too similar.
Are you enjoying this post? If so, be sure to subscribe for occasional email updates from our team!
The Best Practice for Scheduling Social Media Posts
If, after gaining a better understanding of the pros and cons associated with pre-planning your posting schedule, you do choose to do it, there are some guidelines you will want to follow.
Include Variety
Don’t make the mistake of constantly posting repeat content. Certain situations will call for information to be shared more than once, but as a general rule you should offer your audience fresh material. Additionally, mix in some live postings with your pre-scheduled content.
Make Sure Everything Works
Make it a point to regularly check your content to ensure your links are still active and that all of the social media accounts you have connected to your advanced scheduling application are still in working order.
Stay Relevant
Pay attention to what’s going on in the world around you! This point cannot be stressed enough. Posting overly-promotional or irrelevant content during a time where the rest of the world (or even your local community) is focused on a bigger topic could be extremely detrimental to the overall health of your brand image and marketing efforts.
Keep Your Content Messaging on Topic
If your business is in the health and wellness arena you won’t necessarily want to post content offering financial tips to your followers. Know your area of expertise and stick with it! Similarly, make sure everything you post is a clear reflection of your brand personality.
Don’t Over-Extend Yourself
Not all social media platforms will benefit your particular business. Before you create profiles on fifty random platforms, do your research to determine which ones will offer you the most value. See which will help you reach your target market most effectively. The quality of what you post is far more important than the number of platforms you can be found on.
Add Value to Your Followers
If you do have multiple social media platforms, make sure you aren’t posting the same stuff on each of them at the exact same time. Give your audience a reason to follow you on Facebook and Twitter or Instagram. Also, different platforms will attract different audiences who will react to your content. So, make sure you’re adding value to their experience on whichever platform they see you.
Your Next Steps for Scheduling Your Social Media Posts
Now that you understand scheduling your social media posts, it’s time to do your homework. First, determine which social media platforms will best suit the needs of your business. Also, determine which will be of the greatest interest to your target audience. Next, educate yourself on the days and times the platforms you use have the highest level of user engagement. Then, create a marketing strategy that will offer your audience pertinent information, variety, and incentive to further interact with your business. Finally, start scheduling your social media posts and watch your business grow!
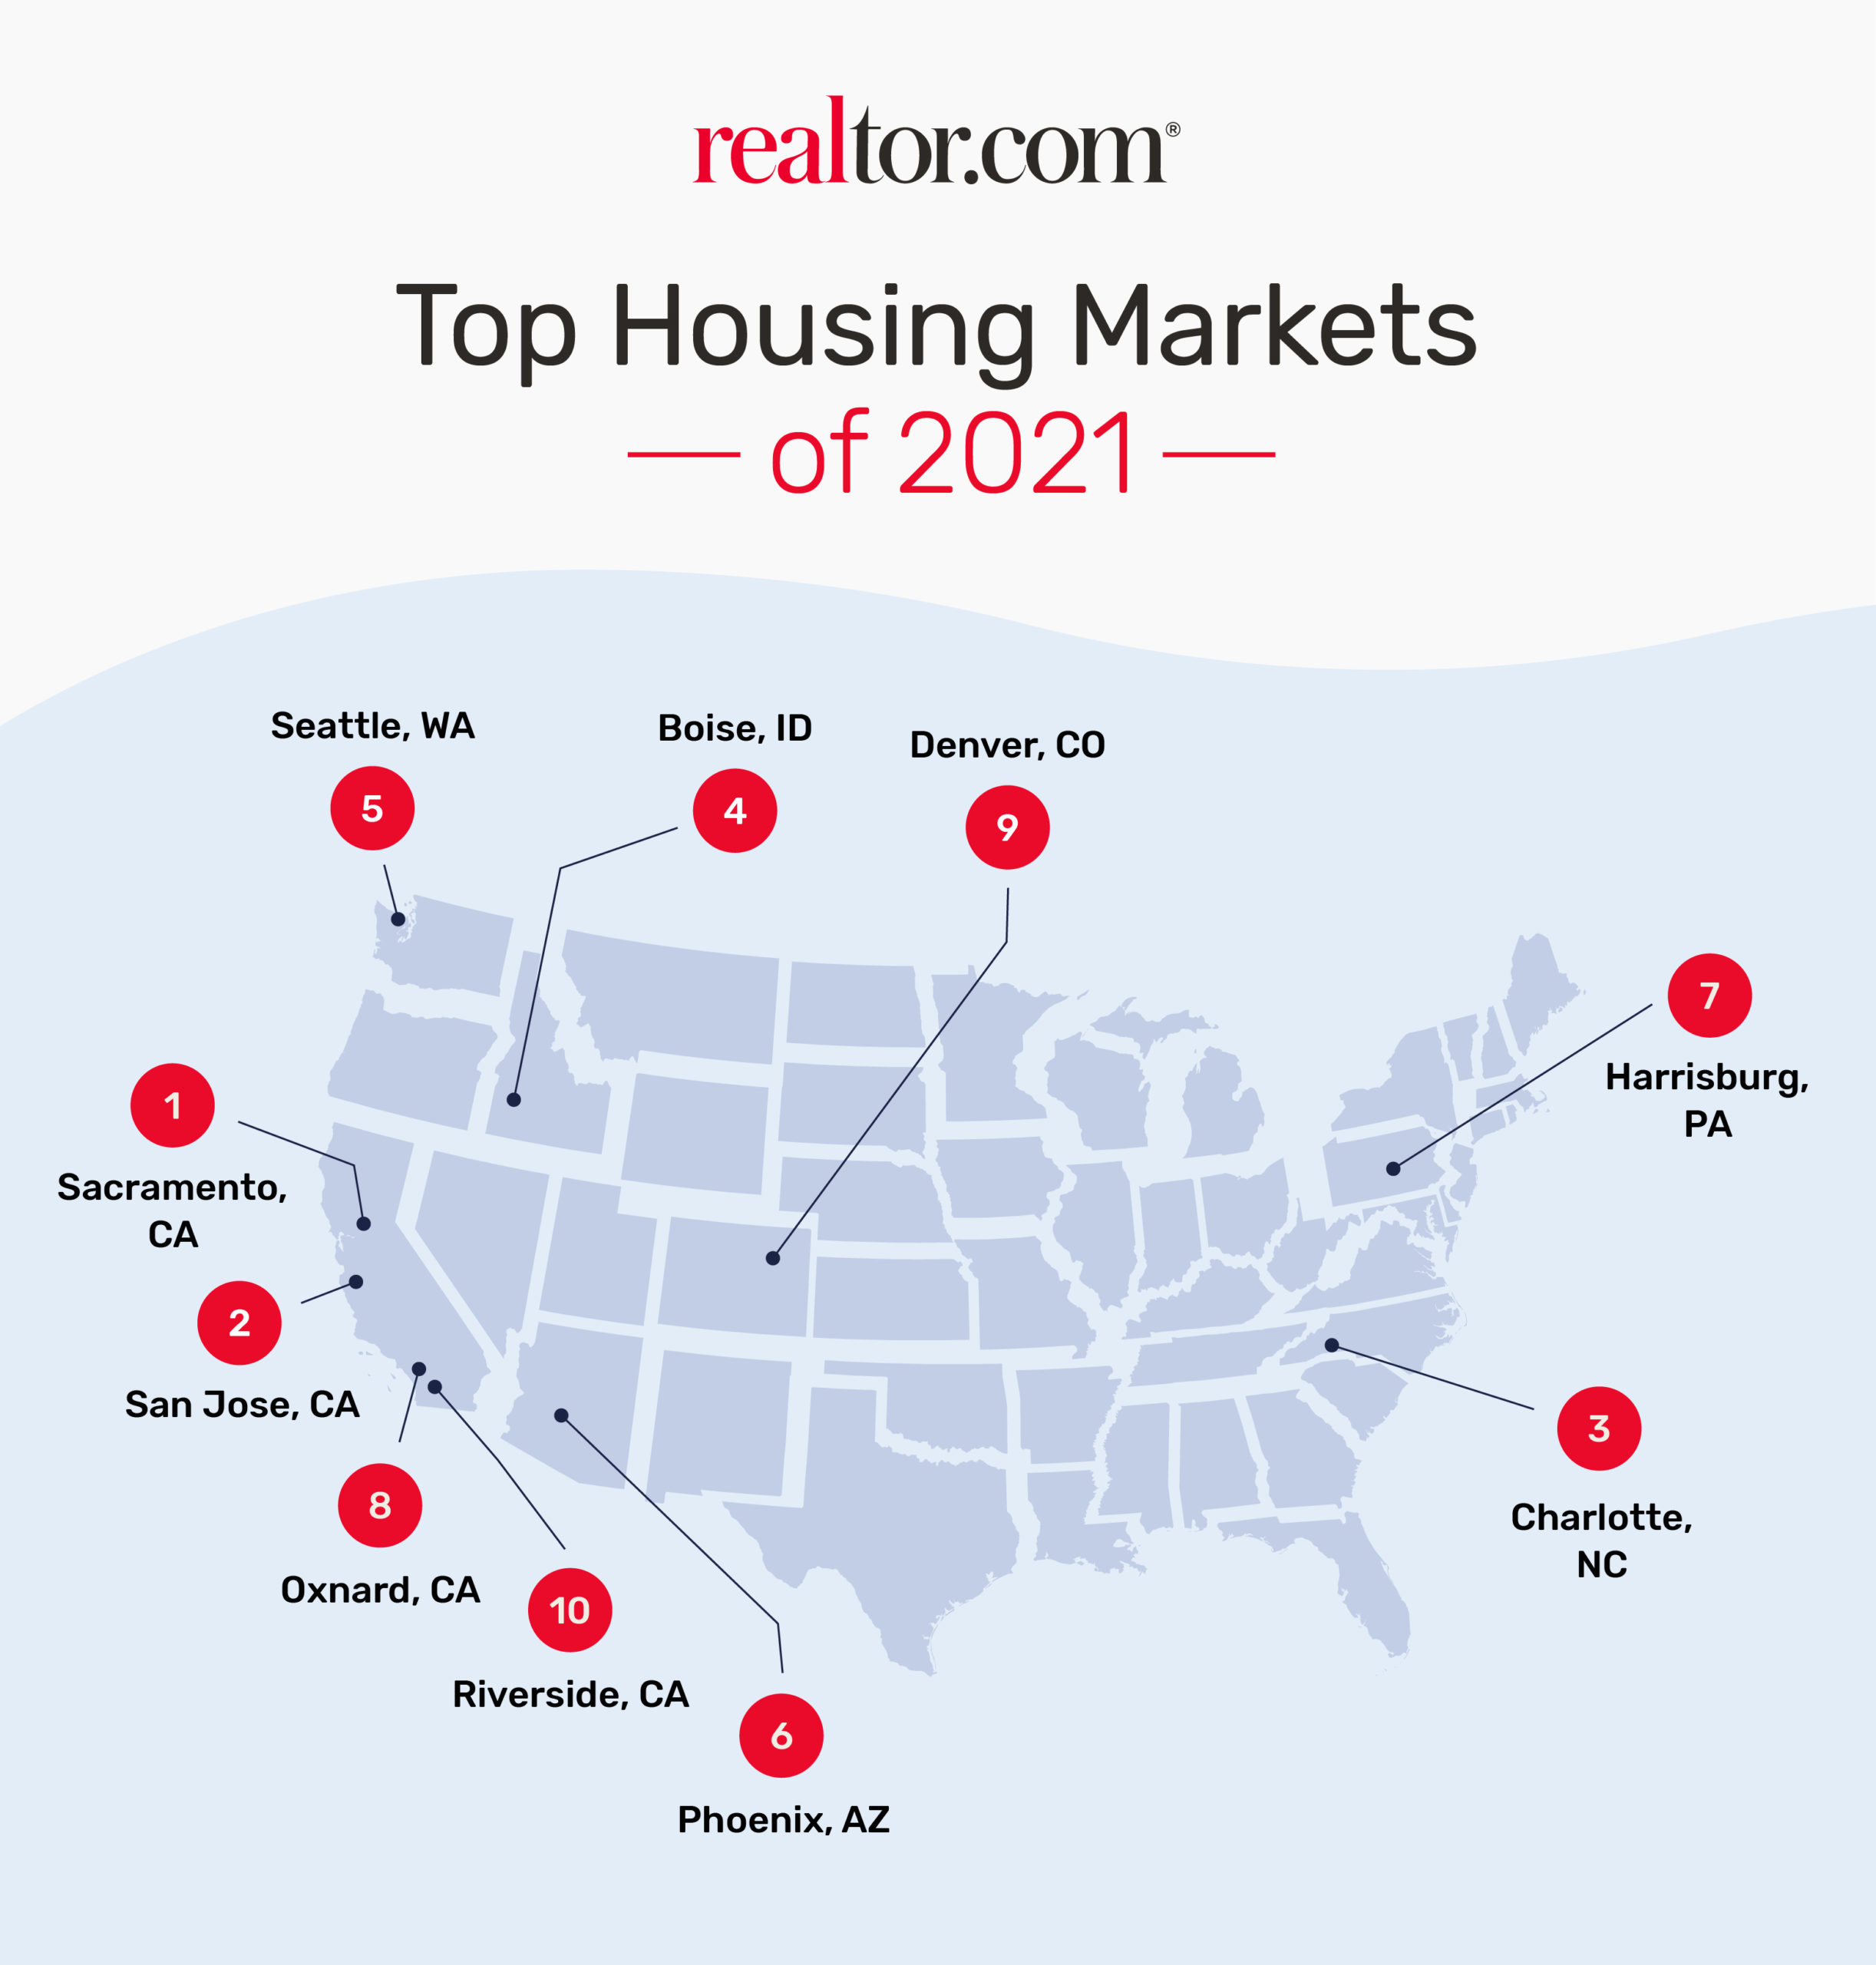
Realtor.com’s top 10 housing markets for 2021 have substantial momentum from 2020 which they will carry into 2021. Still low mortgage rates throughout most of the year help these markets see price and sales growth on top of 2020’s high levels. Economic momentum from the thriving tech industry, coupled with healthier levels of supply, will position these markets for growth in 2021. This past year, we’ve all become more reliant on technology to work, learn, and maintain personal connections. The technology hubs that make this possible are thriving, as are their housing markets. Additionally, the relative stability of government jobs in the past year has driven home prices and sales in several state capitals to the top. Home buyers, particularly younger first-time buyers, looking in one of these markets should expect rising prices and heavy competition. Meanwhile, sellers will remain in a position of power, but will find themselves on the other side of the bargaining table when buying their next home.
Top 10 Housing Markets Positioned for Growth in 2021
Ranking is based on the combined yearly percentage growth in both home sales and prices expected in 2021 among the top 100 largest markets in the country per realtor.com’s metro level housing forecast. In cases of a tie, Sales Growth y/y was used as a tiebreaker.
Tech Titans
A common driver of this year’s top markets is the prevalence of high paying tech jobs. Tech salaries in Sacramento, San Jose, Boise, Denver, and Seattle have driven home prices through the roof over the last several years and this trend is expected to continue in 2021. Additionally, areas such as Charlotte and Phoenix are quickly establishing themselves as rising tech hubs with a plethora of jobs in technology, as well as education, government and healthcare. In fact, the projected unemployment rate for 2021’s top markets is 7.9% compared to the national average of 8.2%. Tech-related jobs make up an average of 8.7% of the workforce in this year’s top markets list compared to 6.4% of the U.S. as a whole.
Relative Affordability
The top markets in 2021 aren’t cheap. In fact, home prices in eight of the top 10 markets are more expensive than the average of the top 100 markets. But many are relatively affordable when compared to their nearby counterparts or offer significantly more square footage for a similar price. For example, buyers priced out of New York ($216 per sq.ft.) can find increased space and affordability in Harrisburg ($122 per sq.ft.), while buyers in Sacramento ($284 per sq.ft.) can get more bang for their buck than nearby San Francisco ($679 per sq.ft.). This is also true when comparing Oxnard ($413 per sq.ft.) and Riverside ($247 per sq.ft.) with Los Angeles ($556 per sq.ft.).
Home to Younger Households
On average, the top 10 markets have a larger share of younger households, aged 25 to 34, (14.1%) than the U.S. as a whole (13.5%). A market’s ability to lure millennials is a good indicator of the livability of the area including: job opportunities, dining, and entertainment. However, when it comes to millennials purchasing homes in the top 10, two trends are emerging. In half of this year’s top markets, including: Charlotte, Boise, Phoenix, Harrisburg and Riverside, millennials are already homeowners and expected to make the majority of the home purchases that drive home price growth and sales. In the other group of markets, such as San Jose, Seattle, and Denver, the high cost of living has made homeownership a difficult accomplishment, not only for millennials but for all generations. The high number of millennials in the market shows how popular these markets have become, but older, more financially established generations will be the ones purchasing the majority of the homes next year.
State Capitals
Half of the top markets are state capitals, including: Sacramento, Boise, Phoenix, Harrisburg and Denver. The strong government presence in these areas offers stability for their local economy and jobs markets. This is especially important after a year when a global pandemic has significantly disrupted local economies across the nation. On top of the government jobs, these areas also have strong job diversity in both the public and private sectors, including education, healthcare, technology, manufacturing and military, which is positioning them for solid growth in the future. The average GDP growth rate for the top markets is forecasted to be 5.34% in 2021, versus 4.85% for the top 100 metros.
Sacramento takes first place on this year’s top markets list. Due to the increased freedom to work remotely, buyers from the San Francisco Bay Area are flocking to California’s state capital for the increased affordability, without having to completely uproot their lives in Northern California. The area draws a diverse crowd ranging from first time homebuyers to empty nesters looking to downsize. Many young families are also drawn to Sacramento for the area’s strong school system, including West Campus high school which has a 99% graduation rate and received a 10/10 on greatschools.org. When residents want a change of scenery, it’s a short trip to Lake Tahoe, wine country or San Francisco.
Also located in Northern California, San Jose is the largest city in Silicon Valley. Apple, Google, Facebook, Linkedin and even realtor.com® are all within commuting distance of San Jose. Unsurprisingly, the area’s strong economy and top notch school system, including Lynbrook High School (10/10 greatschools.org), lure top tech talent from all over the country. Those looking for a change of scenery can easily drive to San Francisco or the nearby mountains. Without a ton of room for new construction, inventory in the area is tight, so serious buyers should expect to pay above asking price.
Rounding out the top three on this year’s top markets list is Charlotte. The area’s high quality of life, great weather, strong school system including Providence High (10/10 greatschools.org) and rich history draw a diverse mix of both young and old buyers. Millennials are beginning to transition from the downtown city center toward the suburbs as they raise families and take advantage of the increased affordability and extra space. With access to both the beach and mountains, Charlotte has something for everyone, including kayaking along the Catawba River and hiking the Carolina Thread Trail. Housing supply has been tight, but new construction is booming as builders try to meet current demand. Charlotte was No. 7 on 2018’s top markets list.
Idaho’s capital city is firmly establishing itself as a rising tech hub in the U.S. The area’s high quality of life and strong economy draw people from all over the country, with the biggest influx coming from Washington, Oregon and California. This trend has accelerated as the ability to work remotely has drawn many young workers looking for a slower pace of life, increased affordability, and access to the area’s many outdoor amenities. Boise offers residents a mild four season climate, a vibrant revitalized downtown with plenty of entertainment, as well as a plethora of restaurants and boutique shopping. Outdoor enthusiasts are drawn to the area’s adrenaline pumping outdoor activities such as white water rafting and four different ski resorts. New construction has been booming in Boise over the past few years as builders scramble to keep up with rising demand. Boise is no stranger to realtor.com®‘s Top Markets list, it was No. 1 in 2020 and No. 8 in 2019.
Coming in fifth is Seattle, which is home to some of America’s largest and most well known companies including: Amazon, Starbucks, Costco, Microsoft and Nordstrom. The area’s booming tech scene, high quality of life, and access to both the water and mountains draws a crowd from all over the country. New and growing families will find a strong school system, including Greenwood Elementary School which scored a perfect 10/10 on greatschools.org, as well as four other schools which received scores of 9/10. Driven by high home prices and the desire for more space, buyers are beginning to search for homes further from the downtown center. This is especially true for first time homebuyers.
Arizona’s state capital has become a magnet for both younger buyers looking to take advantage of the affordable cost of living, as well as retirees who want to soak up the sun. Recently, the area has seen a large influx of people from pricey West Coast markets — San Francisco, Seattle and Portland. While builders have struggled to meet the rising demand for housing, Phoenix set a record for new home permits in March, April and May, so new inventory is on the way. Phoenix offers residents all the big city amenities of shopping, dining and entertainment, without the traffic of larger metropolitan cities. Additionally, those who want to get out and hit the golf course have over 400 courses to choose from. Phoenix is a business friendly city and has a diverse list of large employers in both the public and private sectors from education, government and healthcare to technology, manufacturing and military. Phoenix was No. 5 on 2019’s top markets list.
The state capital of Pennsylvania has become a hot spot for buyers looking for the quiet suburban lifestyle, more space, and increased affordability. Harrisburg is centrally located near New York, Baltimore, Washington D.C., Pittsburgh and Philadelphia. Millennials in particular have been drawn to the area as both first time homebuyers and move-up buyers looking for more space for their growing families. Harrisburg boasts a strong job market not only for government employees working at the state capital, but those in healthcare and shipping industries as well. One of the biggest draws to the area is the ability to go from downtown, to the suburbs, to more rural areas, in under 15 minutes.
Located north of Los Angeles on the Pacific Coast is Oxnard, Calif. The area is a mix of farmland and Pacific Coast beaches, such as Hollywood Beach — a second home market for wealthy Angelanos looking for a break from the hustle and bustle of city life. Farmers in the area grow strawberries and lima beans and the annual Strawberry Festival is a big draw for Southern California locals. Thanks to its affordability, the area has seen a boost in demand from buyers seeking relief from Los Angeles and Orange County home prices. Beach homes in the area are significantly more affordable than those in Malibu or Santa Monica, making this a popular alternative for buyers hoping to get more bang for their buck.
Colorado’s state capitol is located just outside of the Rocky Mountains. The area’s housing market has been red-hot for the last several years and builders have struggled to keep up with the high demand for housing. Though the city is rapidly expanding, it still holds much of its Old West charm, and its cost of living remains relatively affordable compared to other Western markets. Many of Denver’s residents are outdoor enthusiasts who love to take advantage of the area’s easy access to mountains, rivers and lakes. No matter the season, there is an outdoor activity closeby. Denver’s high quality of life is a major draw for many residents, as well as all the amenities of downtown. With boutique shopping, dining, and endless entertainment, the area has been supremely popular with millennials. Due to the area’s spike in demand, home prices have grown rapidly, causing many first time home buyers to search further out from the downtown center.
Located in the Inland Empire, Riverside, Calif., is named for its location along the Santa Ana River. Riverside draws many people who want to take advantage of Southern California’s temperate weather, but don’t want to pay Los Angeles or Orange County home prices. Riverside is centrally located, just 30 minutes to the beach, mountains or desert, making it a great location for anyone that loves to be outdoors. Additionally, it’s in close proximity to Southern California’s attractions of Disneyland in Anaheim, skiing in the San Bernardino Mountains, wine tasting in Temecula or the endless entertainment in Los Angeles. Due to Southern California’s high cost of living, Riverside’s relative affordability and strong school system including Riverside Stem Academy(9/10 greatschools.org), have made it a popular destination for first time homebuyers, growing families, and retirees.